Radio Polis 99.4
Turning a local FM station into a measurable digital product.
- Category
- Mobile · Media · Gamification
- Platforms
- iOS, Android, Web, Admin dashboard
- Station
- Radio Polis 99.4, Larissa
The problem
Radio Polis 99.4 broadcasts from Larissa and is genuinely loved in its city — but like most regional stations, everything it knew about its audience stopped at the transmitter. There was a stream, and there was silence. No idea who listened, when, for how long, or from where. No way to reach listeners between songs. No reason for anyone to choose the station's own channel over a generic aggregator.
The brief was not "build an app". It was: give the station a direct relationship with its listeners, and give it numbers it can actually act on.
Listening, and a reason to keep listening
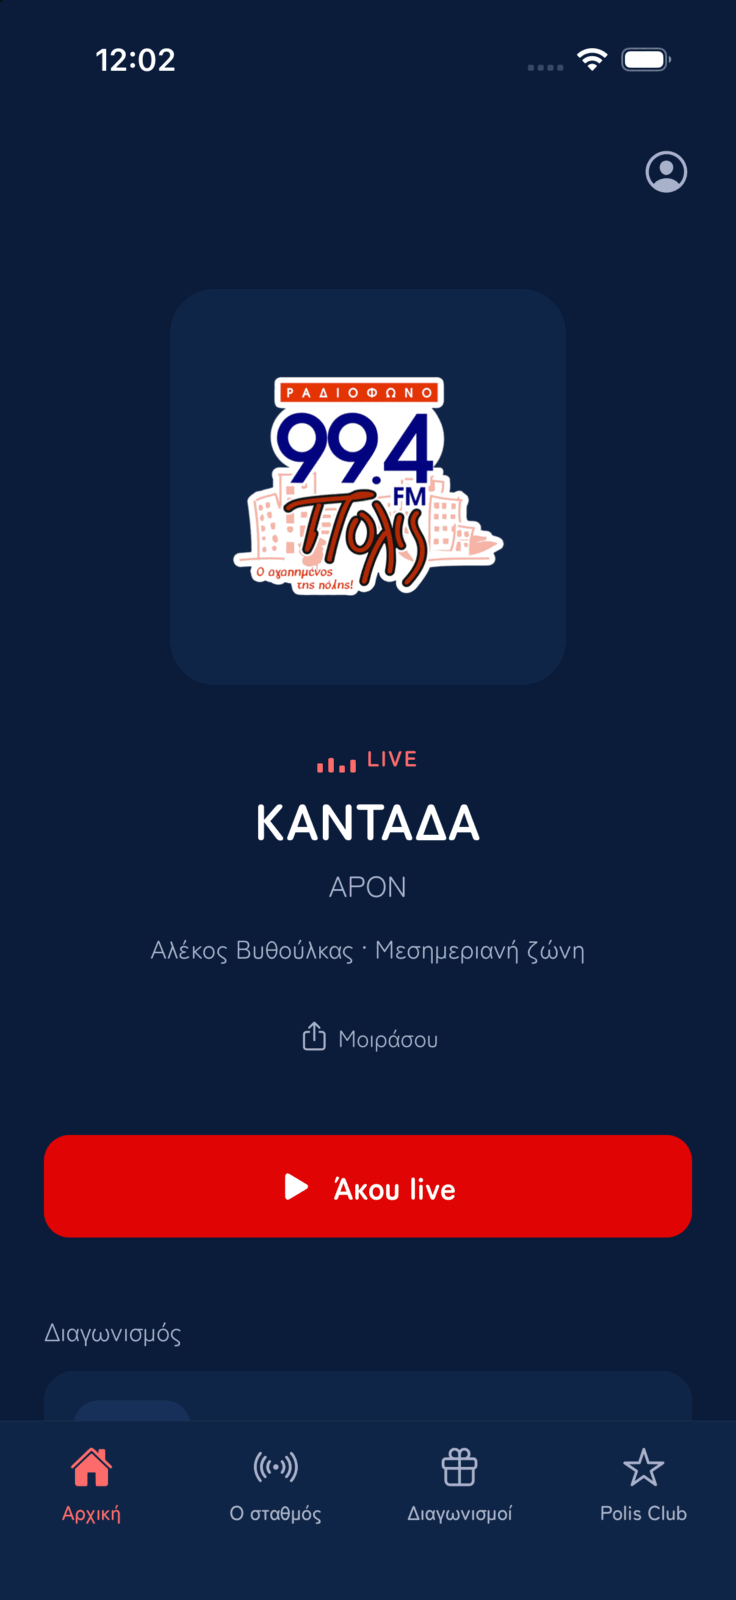
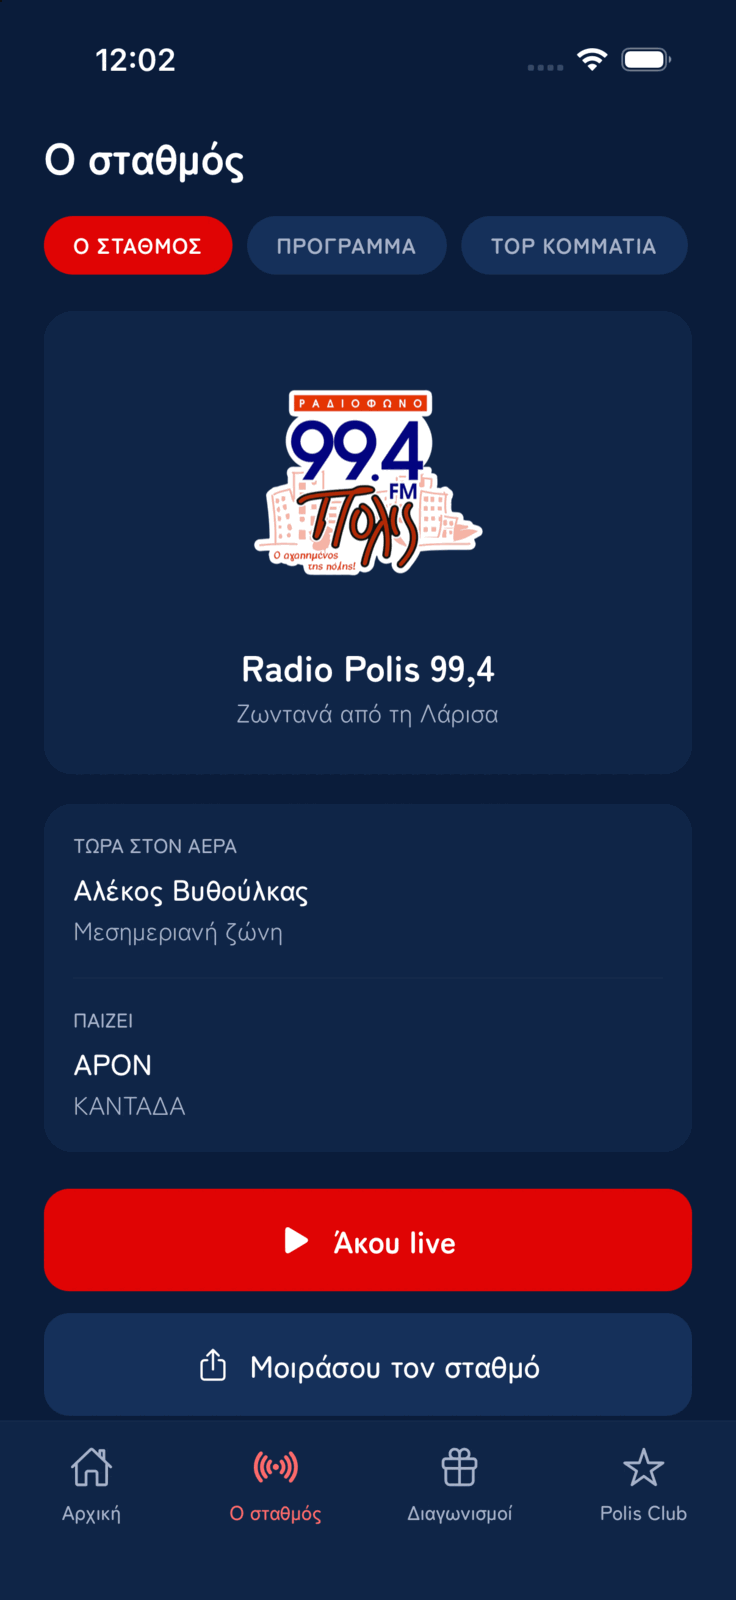
A listening app for iOS and Android with background audio, lock-screen controls and live metadata.
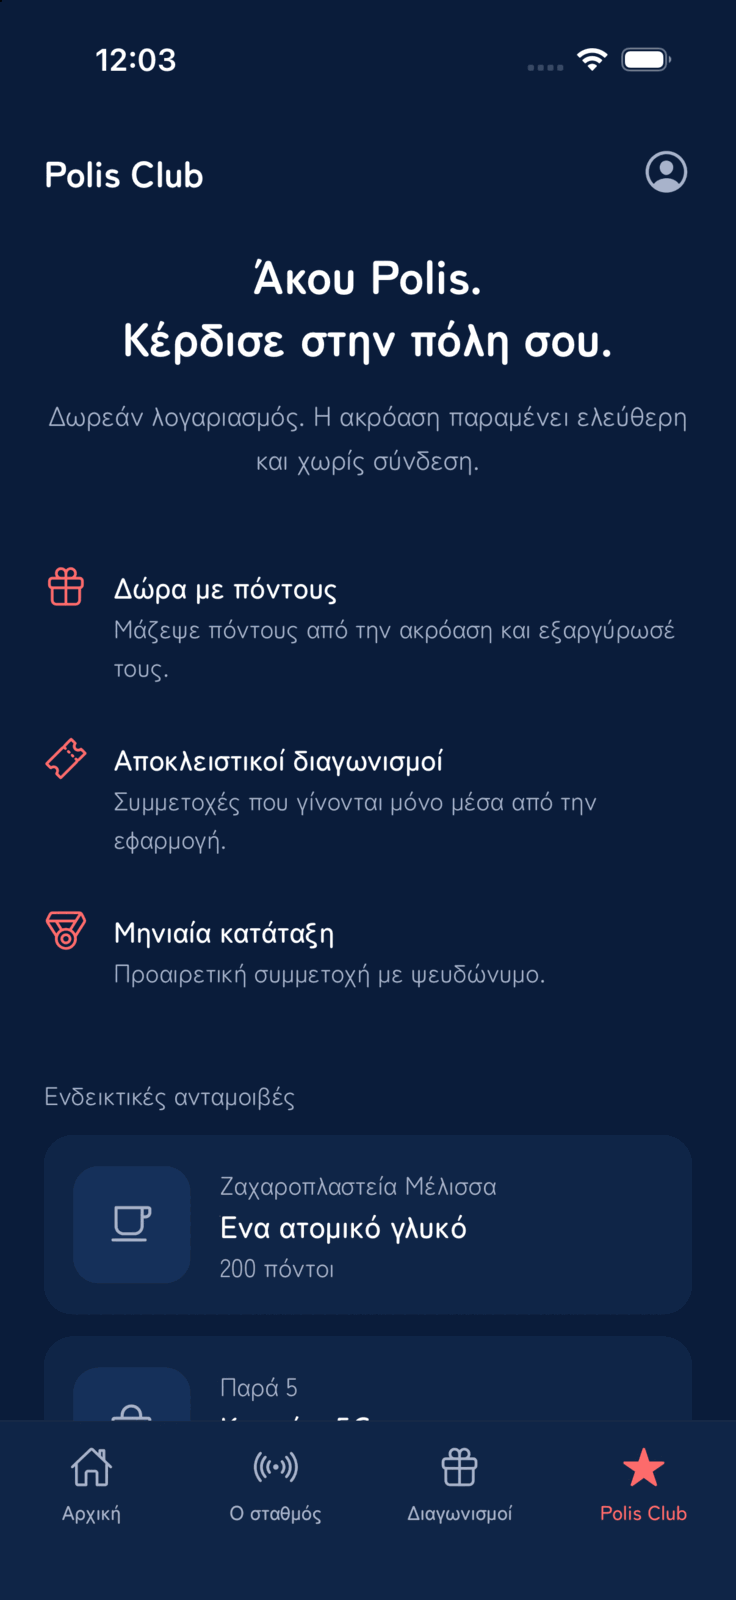
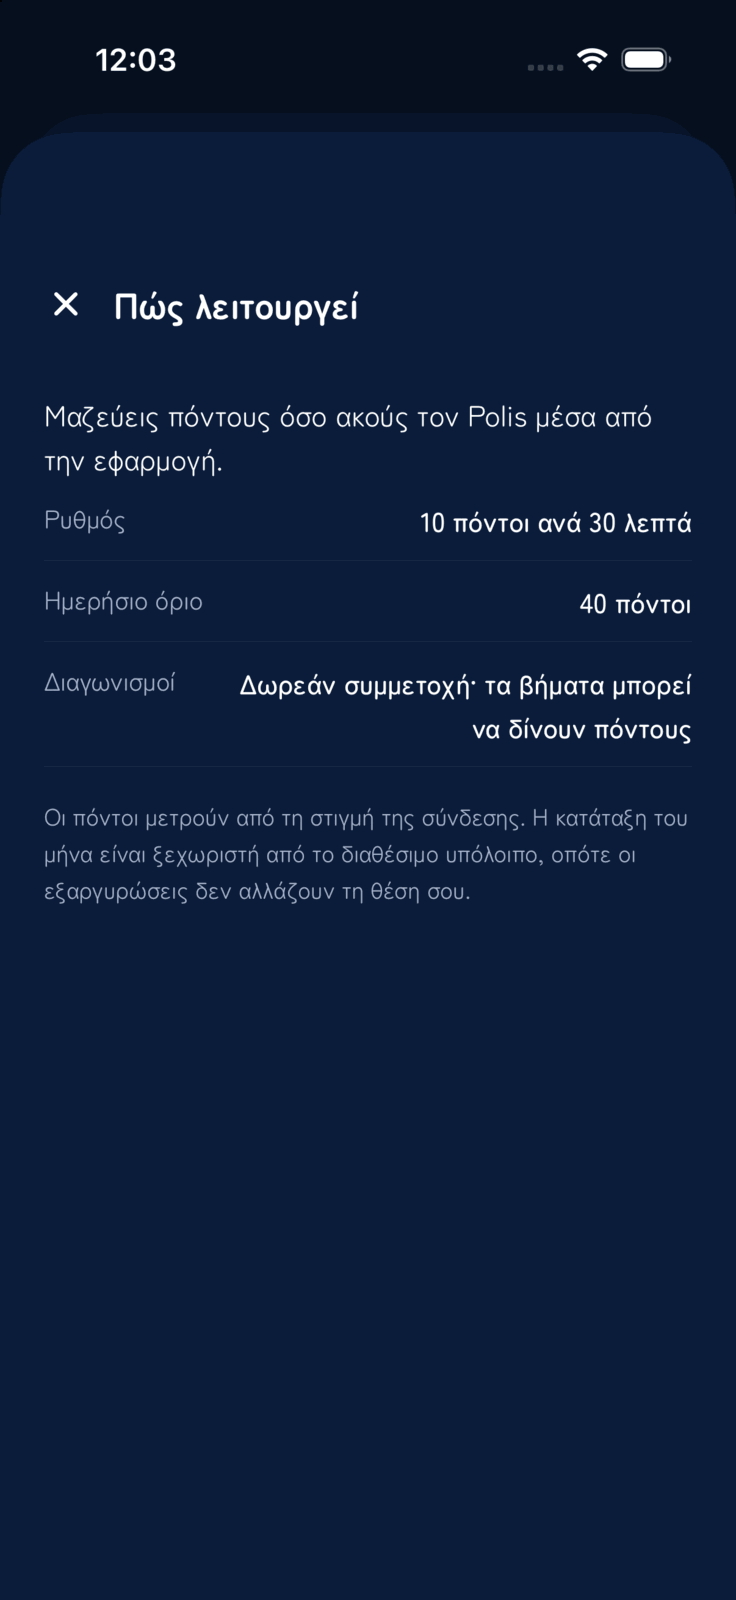
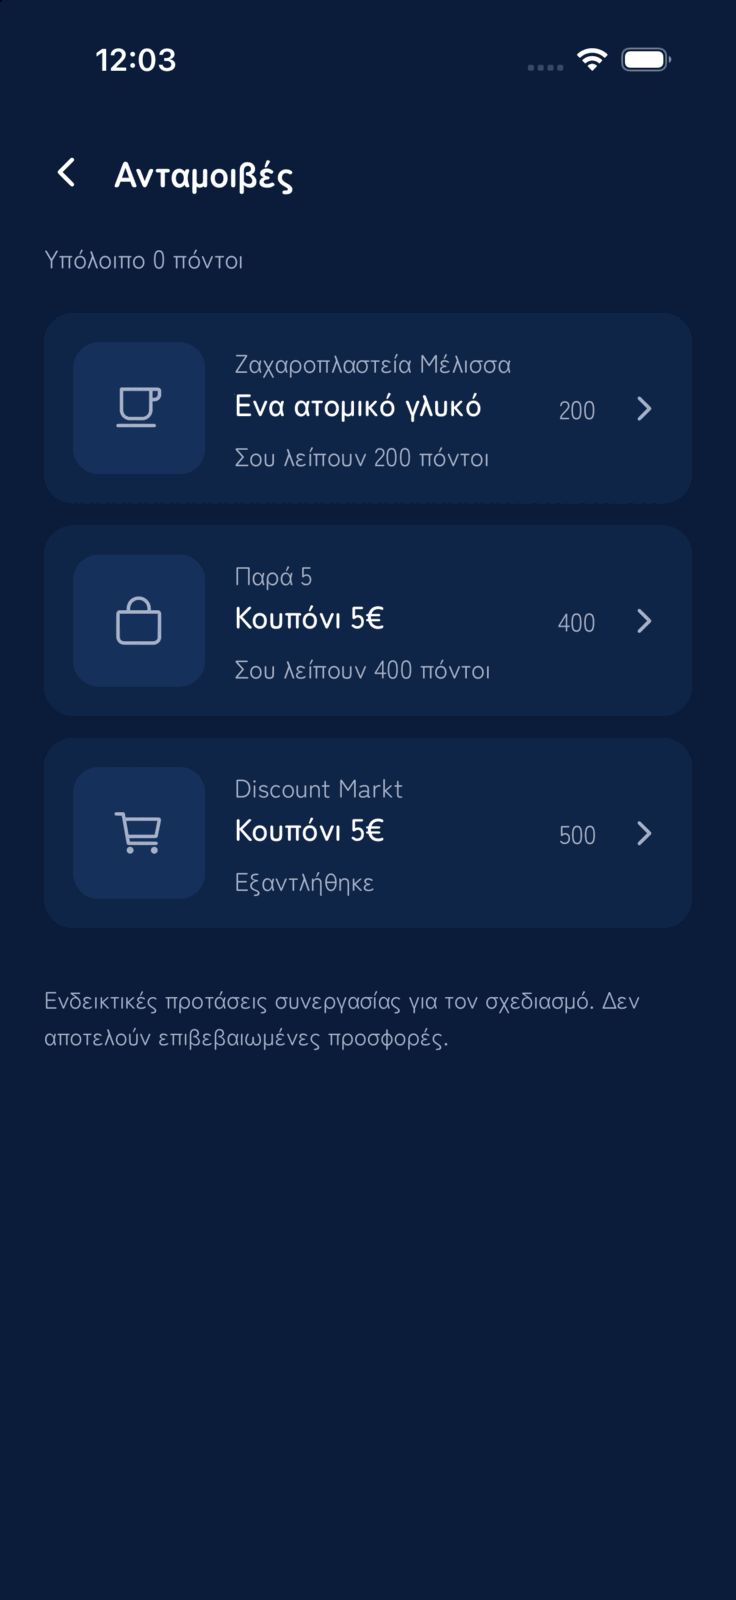
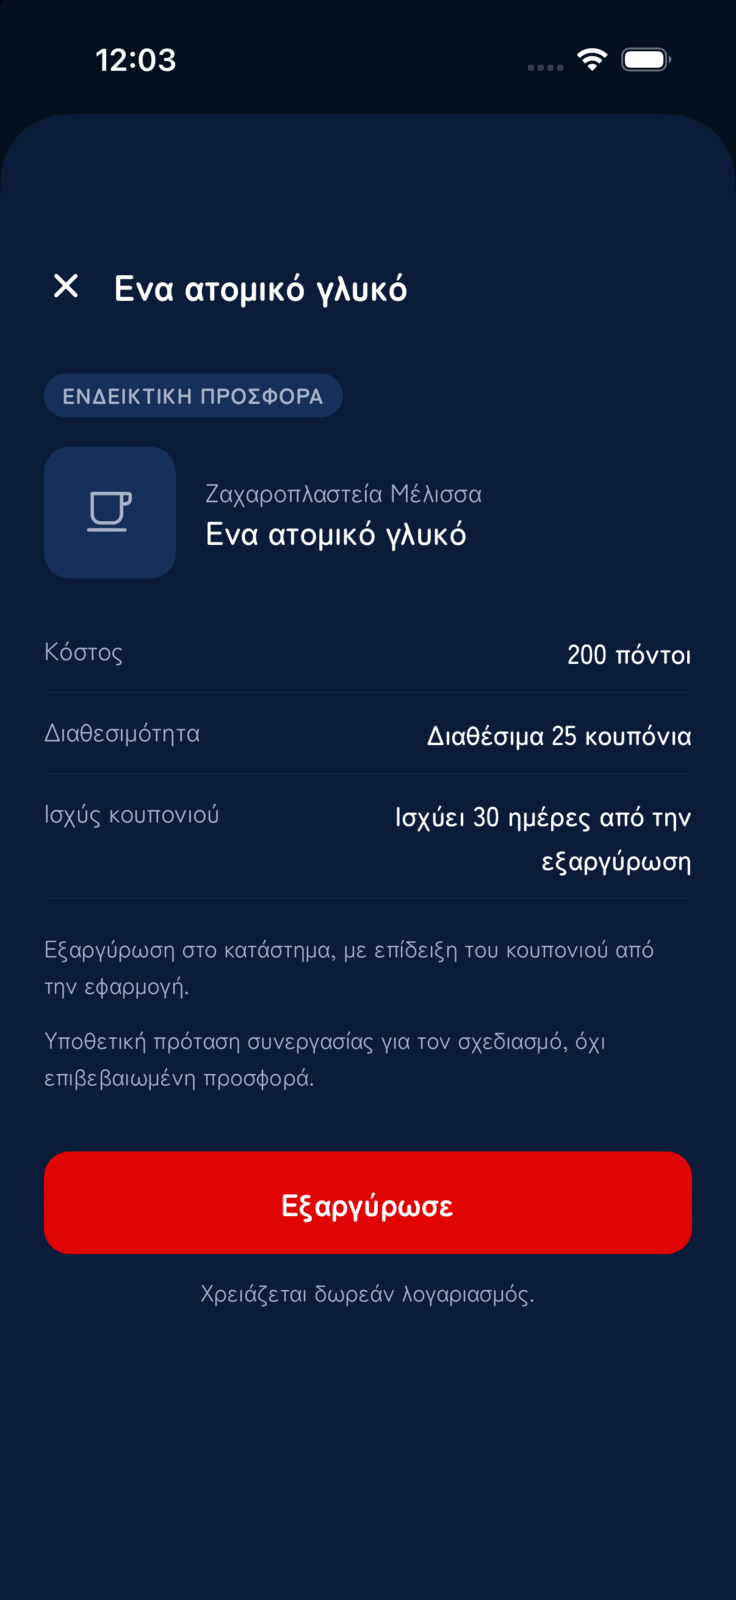
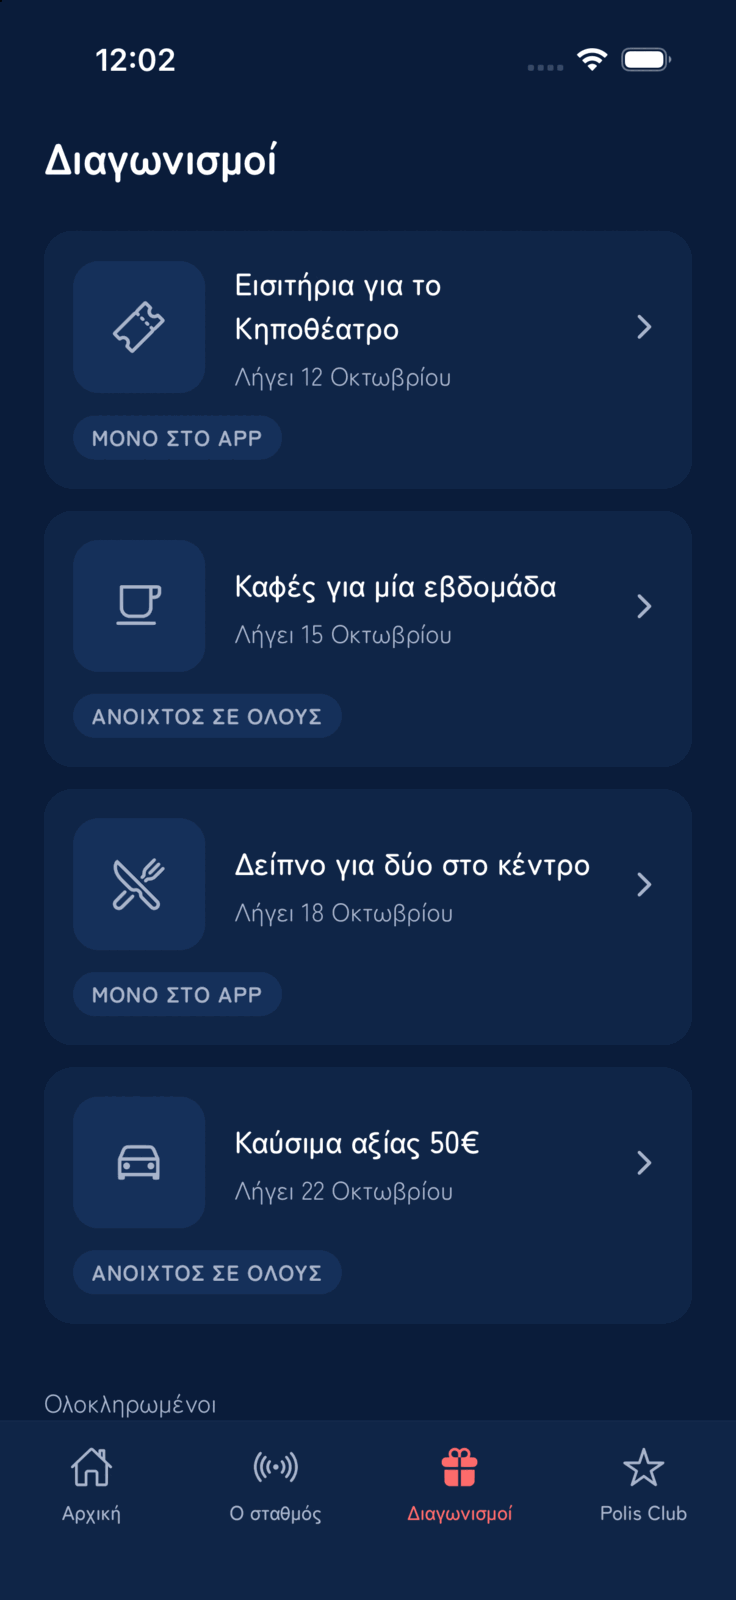
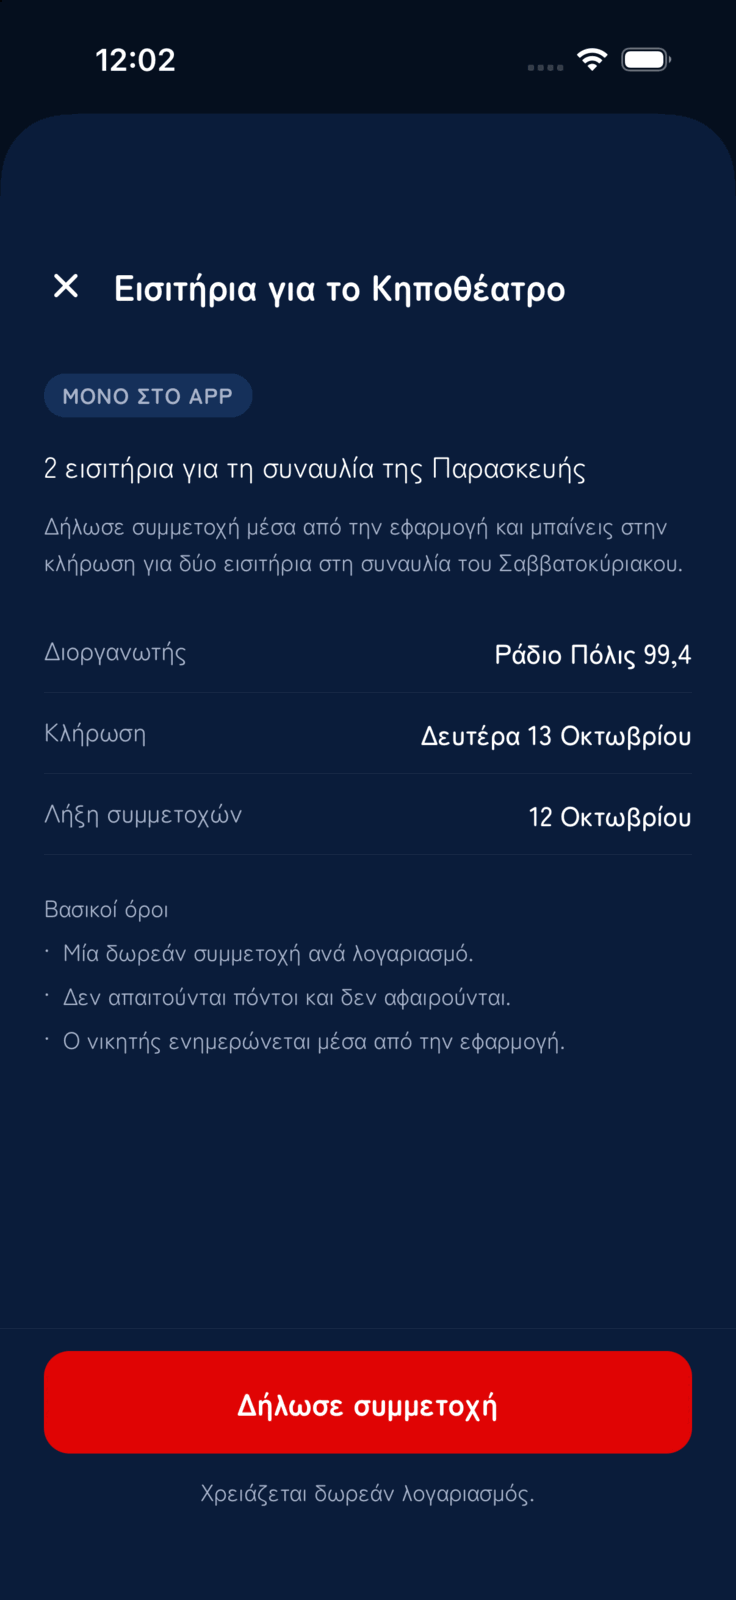
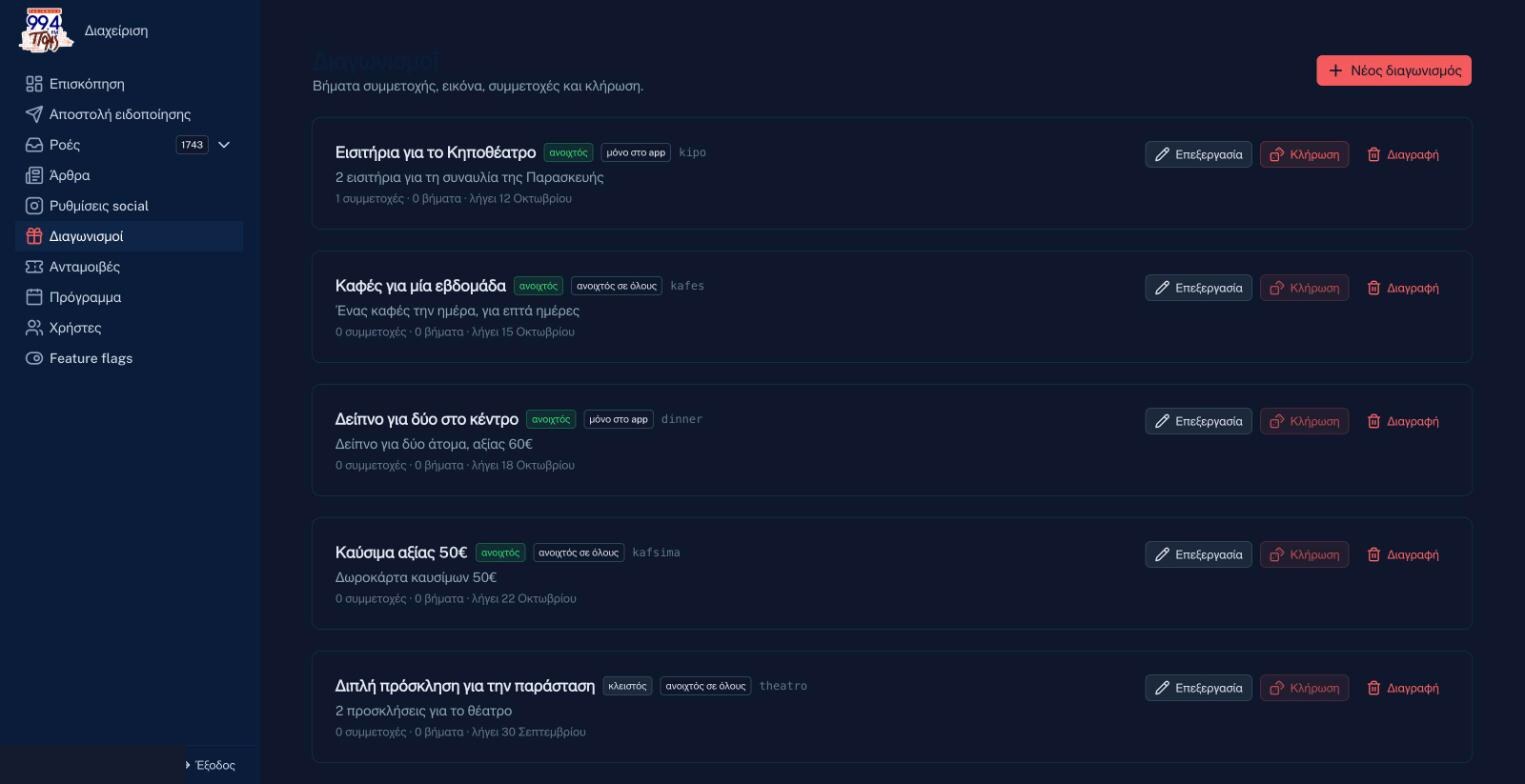
On top of it, a gamified loyalty layer. Listening earns points continuously — 10 points every 30 minutes, capped at 40 a day, not a reward withheld until some arbitrary threshold. Points unlock real rewards from local businesses: a coffee, fuel, theatre tickets, dinner, redeemed with a coupon in the app. A monthly leaderboard turns listening into a light, public competition.
The gamification is not decoration. It answers the only question that matters for a local station: why would someone choose your stream over the hundred others on their phone?
Numbers the station can act on
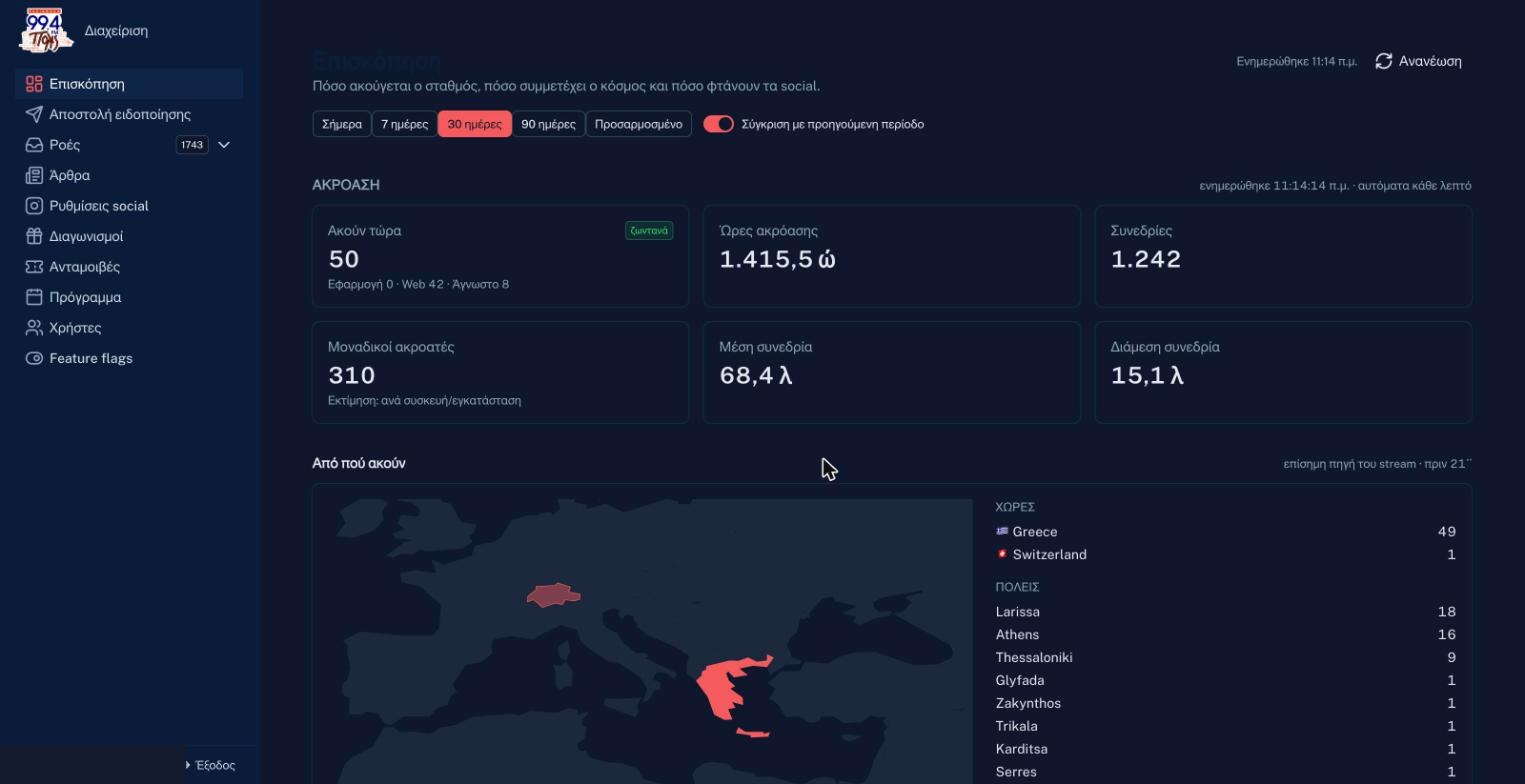
For the first time the station can see who is listening, from where, for how long, and which show holds them.
Live listeners come from the stream's own API — the authoritative count, including people on smart speakers, aggregators or a bare stream URL. A heartbeat measurement sits underneath it and answers the question the stream cannot: app versus web. Listening time counts only the seconds where audio genuinely played.
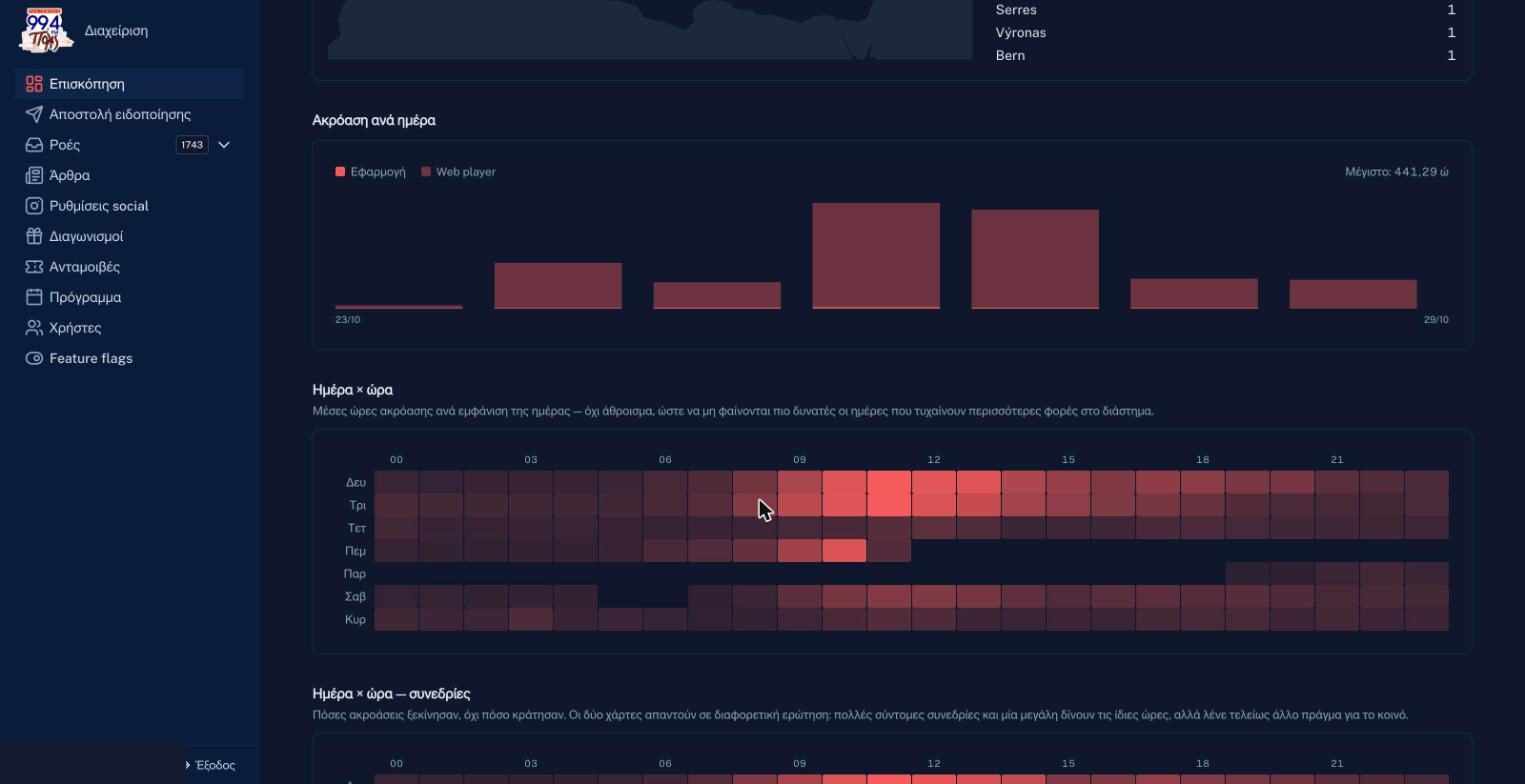
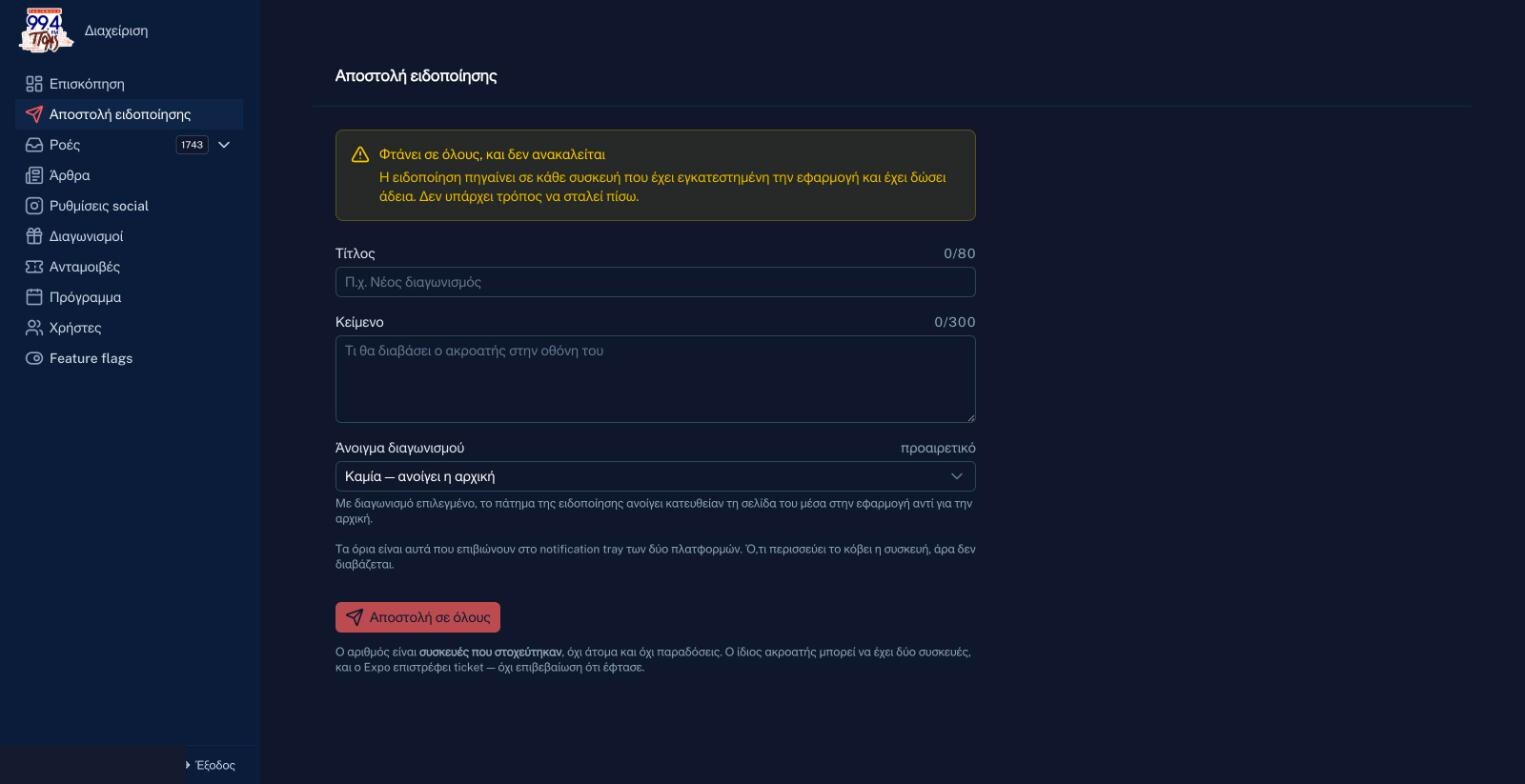
Geography lands on a map — country and city of every current listener. Day-by-hour heatmaps show when people listen and when they start. Push campaigns are measured through to attributed listening, and the same dashboard runs the contests, the rewards catalogue, the schedule and a pipeline that publishes one article to several WordPress sites at once.
The audience does the marketing
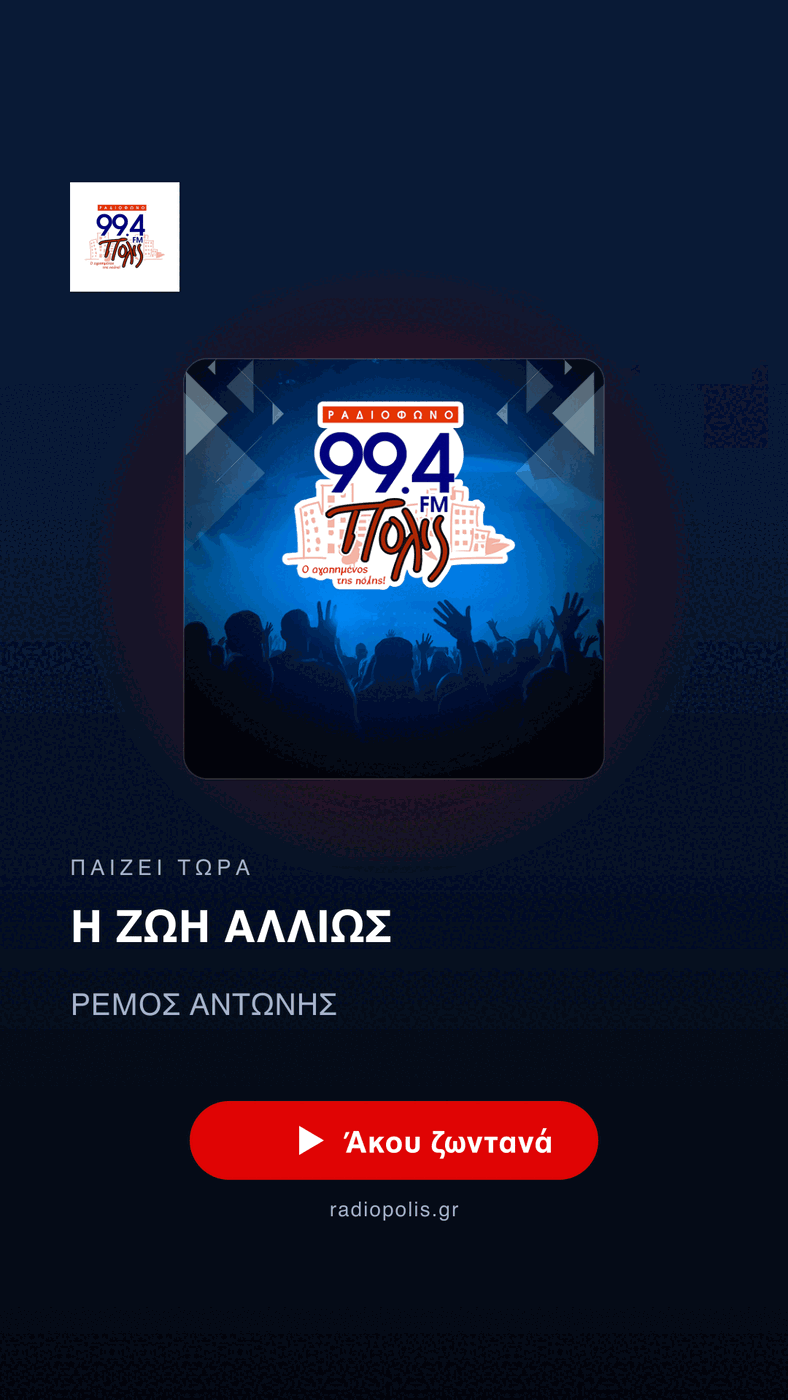
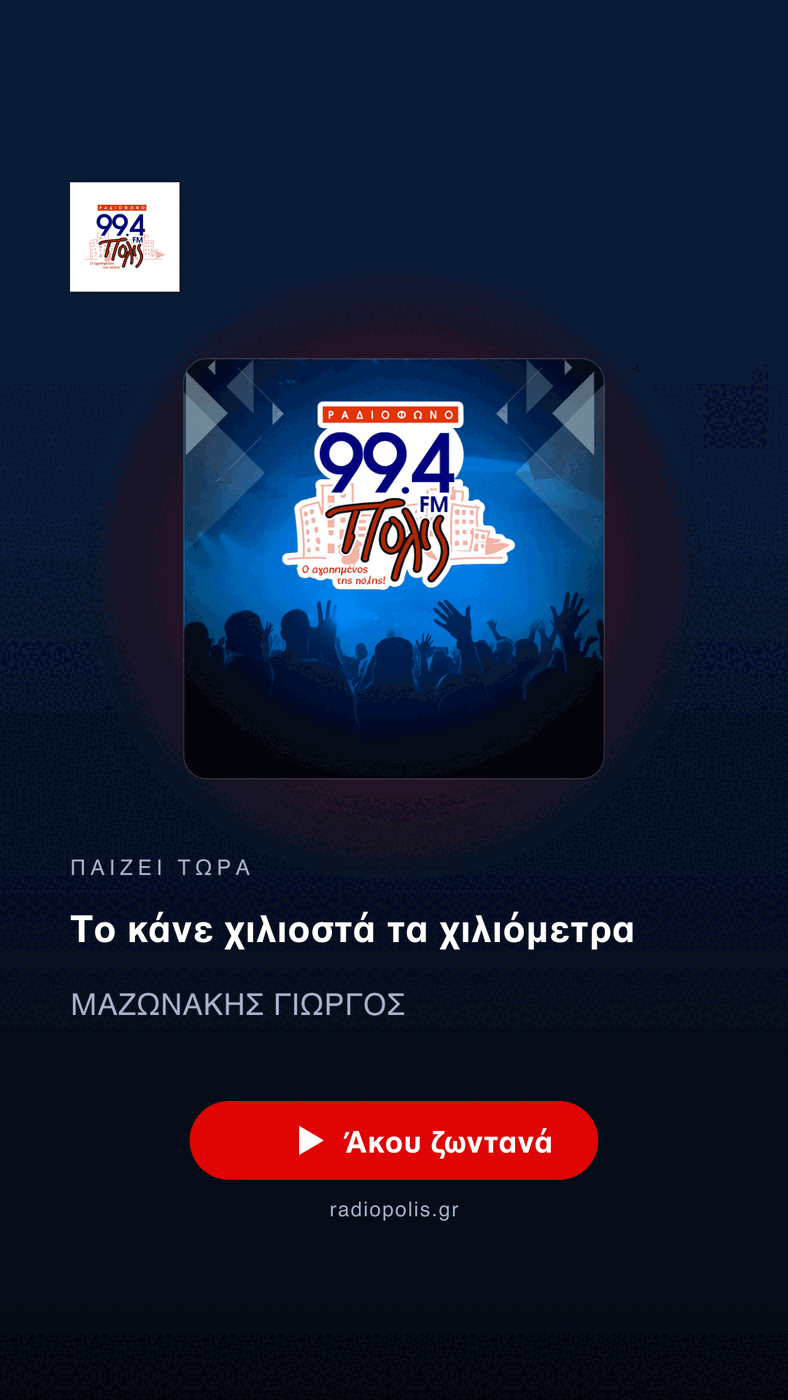
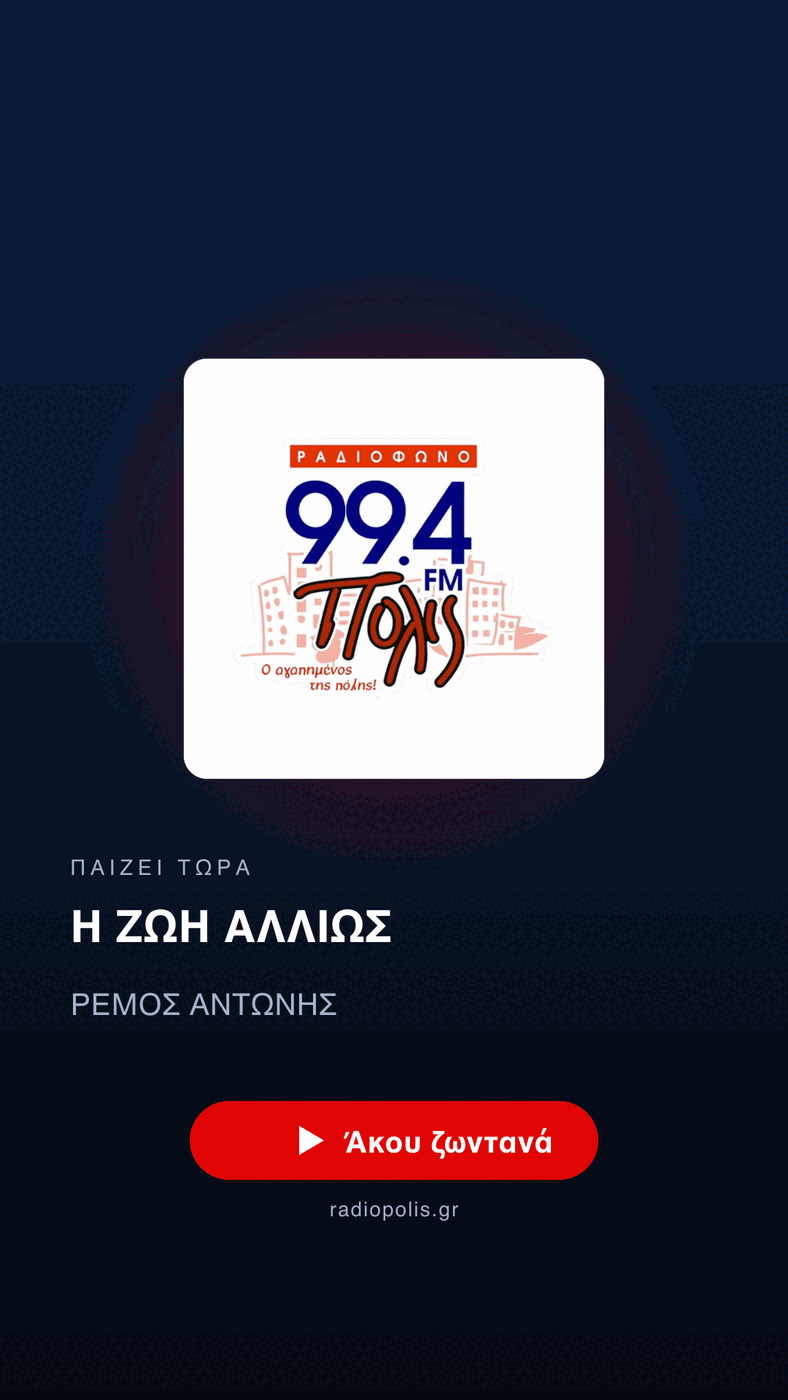
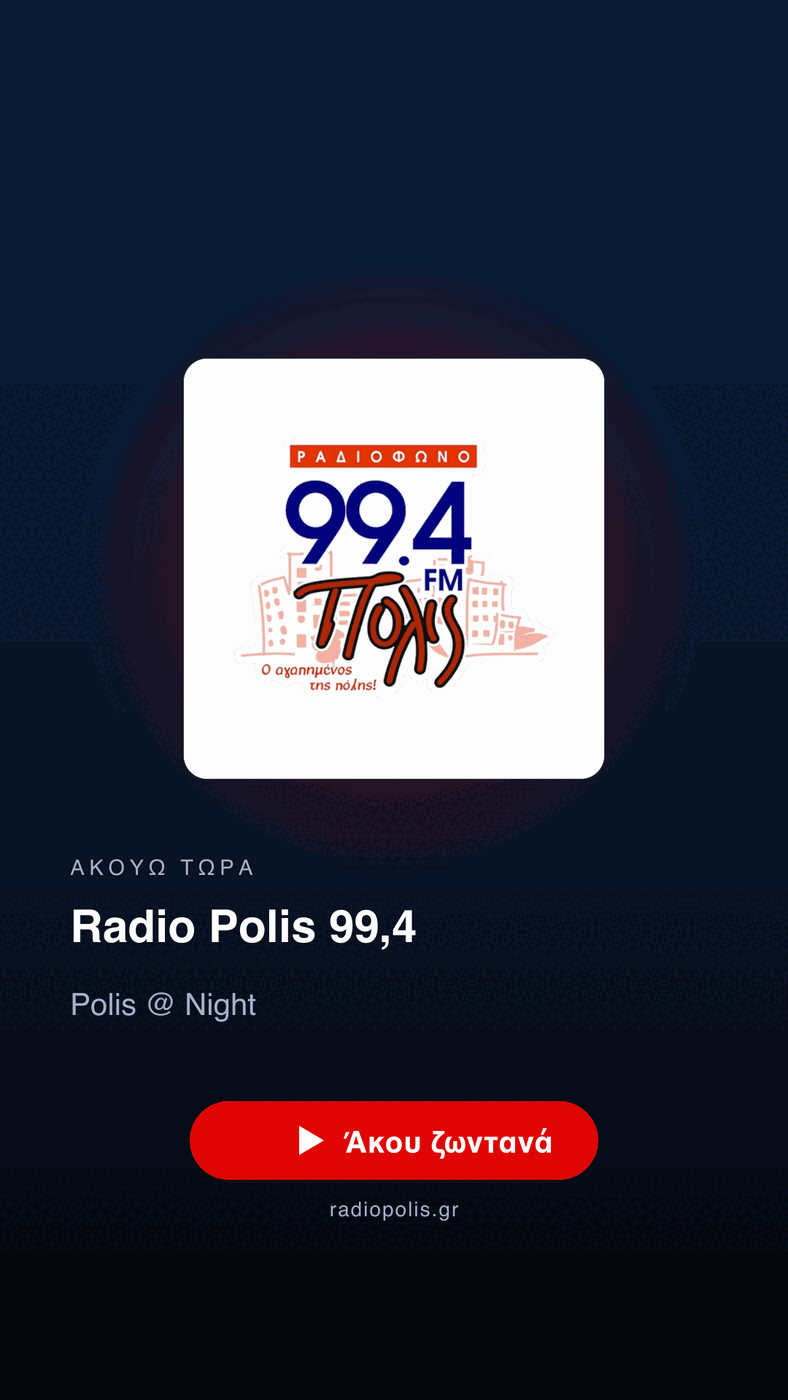
The listener taps once and gets a branded 1080×1920 card with the current track, generated on the device in about a second, handed straight to the Instagram composer.
Every share carries a link back to the station. Organic reach, produced by the audience itself, at no media cost.
Four variants cover what actually comes off a live stream: cover art, no cover art, a title too long for one line, and nothing playing at all.
Why it matters for a radio station
FM has no feedback loop. A station broadcasts and hopes. This turns a one-way signal into a product with a measurable audience: the programme director can see which shows hold people and which lose them by the half hour; the commercial team can show a sponsor real listening hours and real geography; and the station owns the relationship with its audience instead of renting it from an aggregator.
- Live, per-source listener counts where previously there was no number at all
- Geographic reach made visible for the first time — the audience extends well beyond the broadcast radius
- A direct push channel to every installed device, with measured opens and attributed listening
- Local businesses integrated as reward partners, turning audience attention into a tangible local economy
- Shareable, branded Stories that put the station in listeners' social feeds at no media cost
How it is built
A single React Native codebase ships both platforms. Deployment is containerised with database migrations and an automated test suite. Privacy by design throughout — anonymous device identifiers, no fingerprinting, and no personal data in analytics or exports. Every figure on the dashboard is labelled with its source and its method, so the station knows which numbers are measured and which are estimated.